🥳 Skip the subscription. Pay $199 once for lifetime access— See lifetime plans
🥳 Skip the subscription. Pay $299 once for lifetime access—

May 20, 2026
8 MIN READ
Learning Basics
Learning Basics
Engagement Rate Lies. The Credibility Score Doesn't.
Engagement Rate Lies. The Credibility Score Doesn't.
Engagement Rate Lies. The Credibility Score Doesn't.
Sections
Blog in Short ⏱️
Blog in Short ⏱️
A quick glance at the highlights—perfect for when you're short on time.
A quick glance at the highlights—perfect for when you're short on time.
Engagement rate alone is the easiest influencer metric to fake. One viral post inflates the average. The bot likes to spike the numbers for a week. The real signal is the Credibility Score — Impulze's composite of real-follower %, suspicious-follower flags, and engagement consistency. Read those numbers together, and inflated creators stop hiding.
Here are the key takeaways:
Average ER alone gets faked routinely with one viral post or bot spikes
Impulze's Credibility Score is a 0–100% composite (real-follower %, suspicious flags, engagement quality)
A creator with a Credibility Score under 70% is almost always inflated — regardless of headline ER
The Followers Types breakdown shows the exact split: Real / Influencers / Mass / Suspicious
Pair Credibility with Sponsored Performance % — that tells you how a creator actually performs on paid posts
See all of this in under 10 seconds, long before you wire a deposit
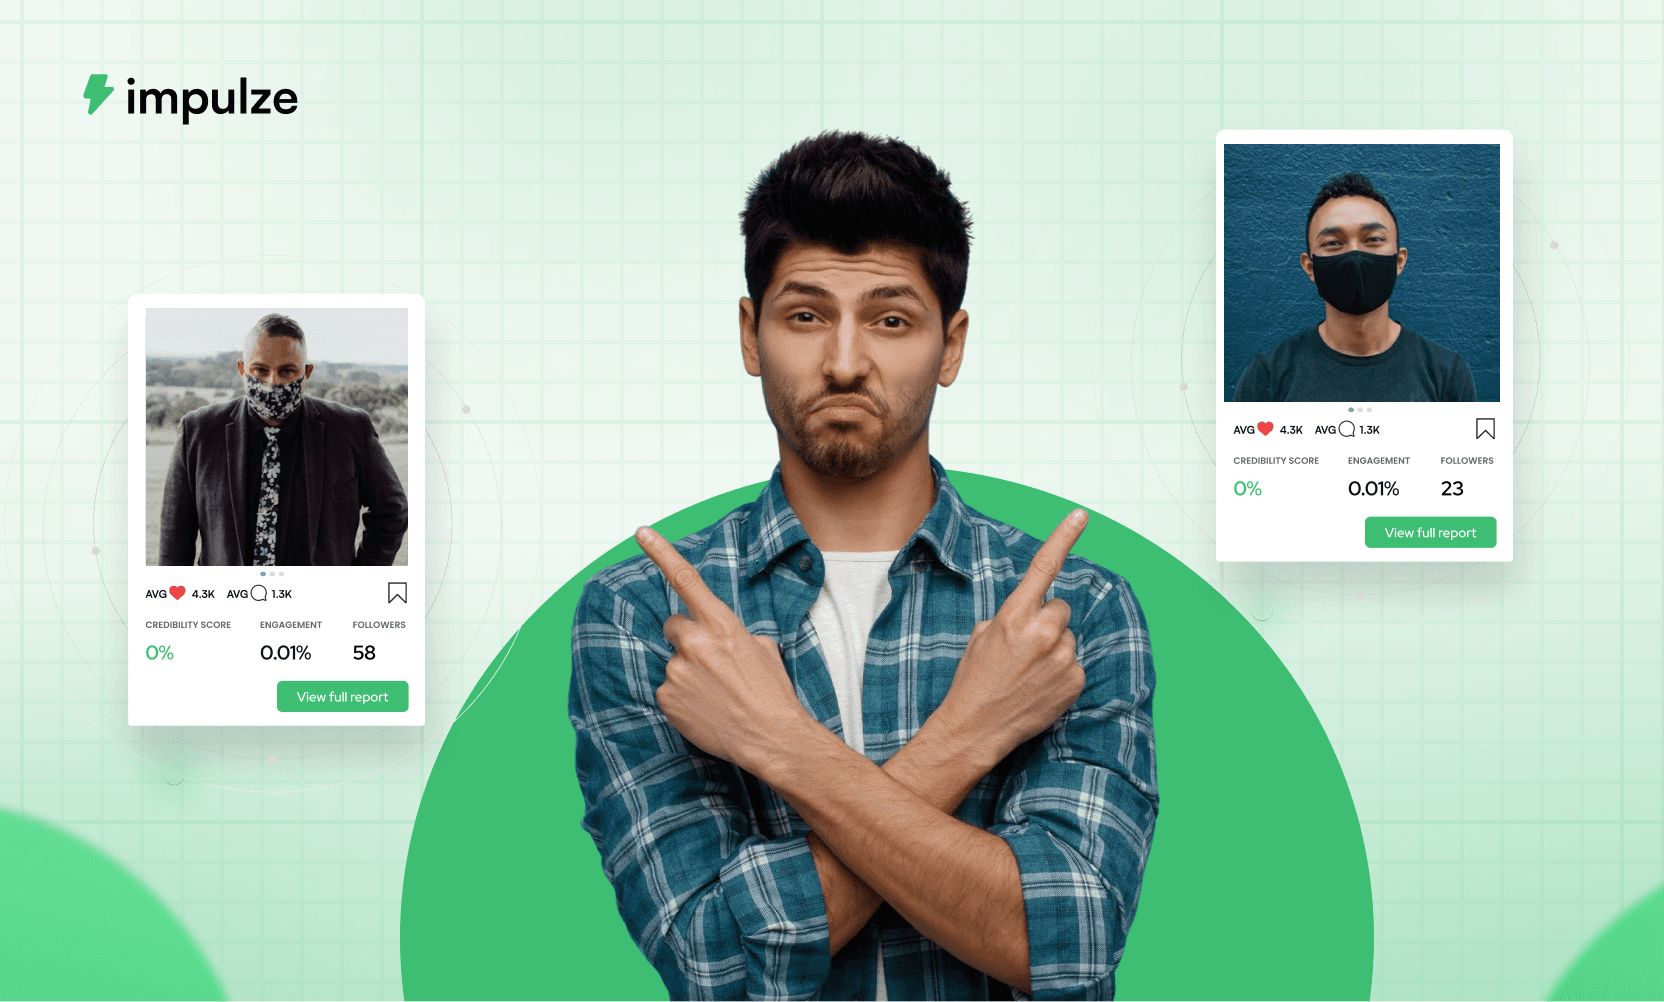
Picture this. You're vetting a creator with 500K followers. Her last post hit 7,200 likes and 1,800 comments — about 1.8% on that post, but her profile page shows an average engagement rate of 12%.
Twelve percent on a half-million account is incredible. You greenlight the deal. You wire $5,000.
The Reel goes live. It does 4,300 likes and 38 comments. You stare at the dashboard. The math you just paid for never existed.
This happens far more often than the industry likes to admit. The cause is almost always the same: brands look at engagement rate in isolation. Let's learn what to read instead.
Why average engagement rate on its own can't be trusted
Average engagement rate is the mean — total interactions divided by total posts, divided by follower count. It's the number every influencer tool surfaces by default because it's the easiest one to calculate, and it's also the easiest to fake.
The two ways it gets inflated:
1. One viral post pulls the average up. A creator who usually gets 2,000 likes hits the algorithm once and lands 80,000 likes. Her average engagement jumps from "okay" to "amazing" for the next 90 days, even though her next 30 posts will go right back to normal.
2. Bot likes get bought. $50 buys 5,000 bot likes spread across recent posts. The average engagement spikes, the profile looks healthy, and the campaign you run goes nowhere because none of those likes belonged to humans who'd buy your product.
Average engagement alone doesn't catch either pattern. The metric that catches both is the Credibility Score.
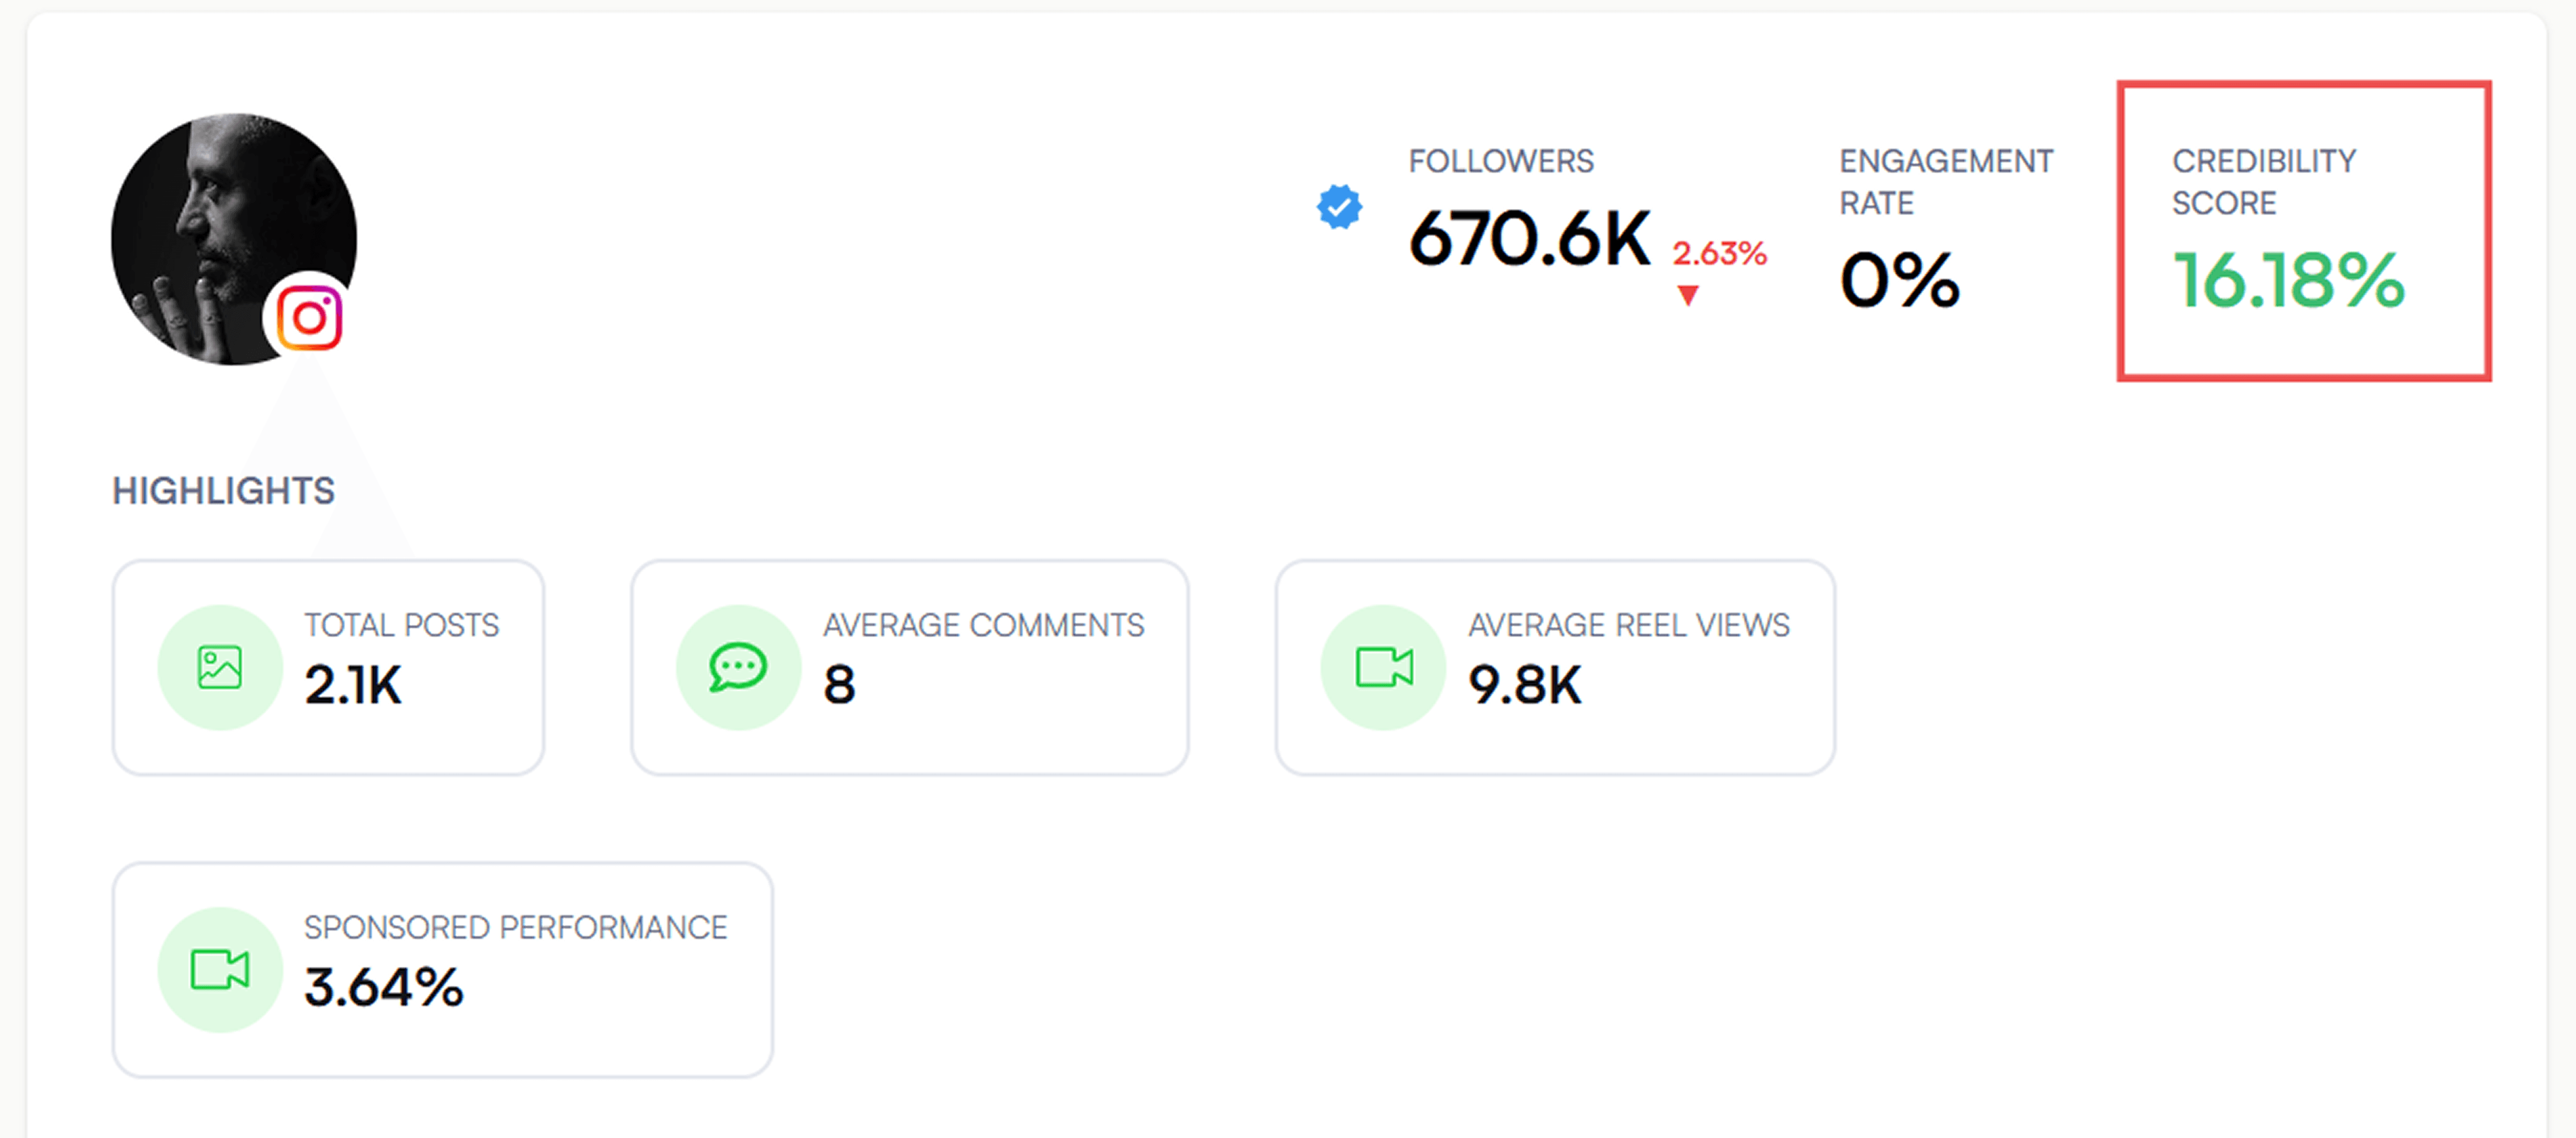
What the Credibility Score actually measures
Inside Impulze, every Influencer Report has a Credibility Score at the top — a 0–100% percentage, color-coded green when healthy, red when not.
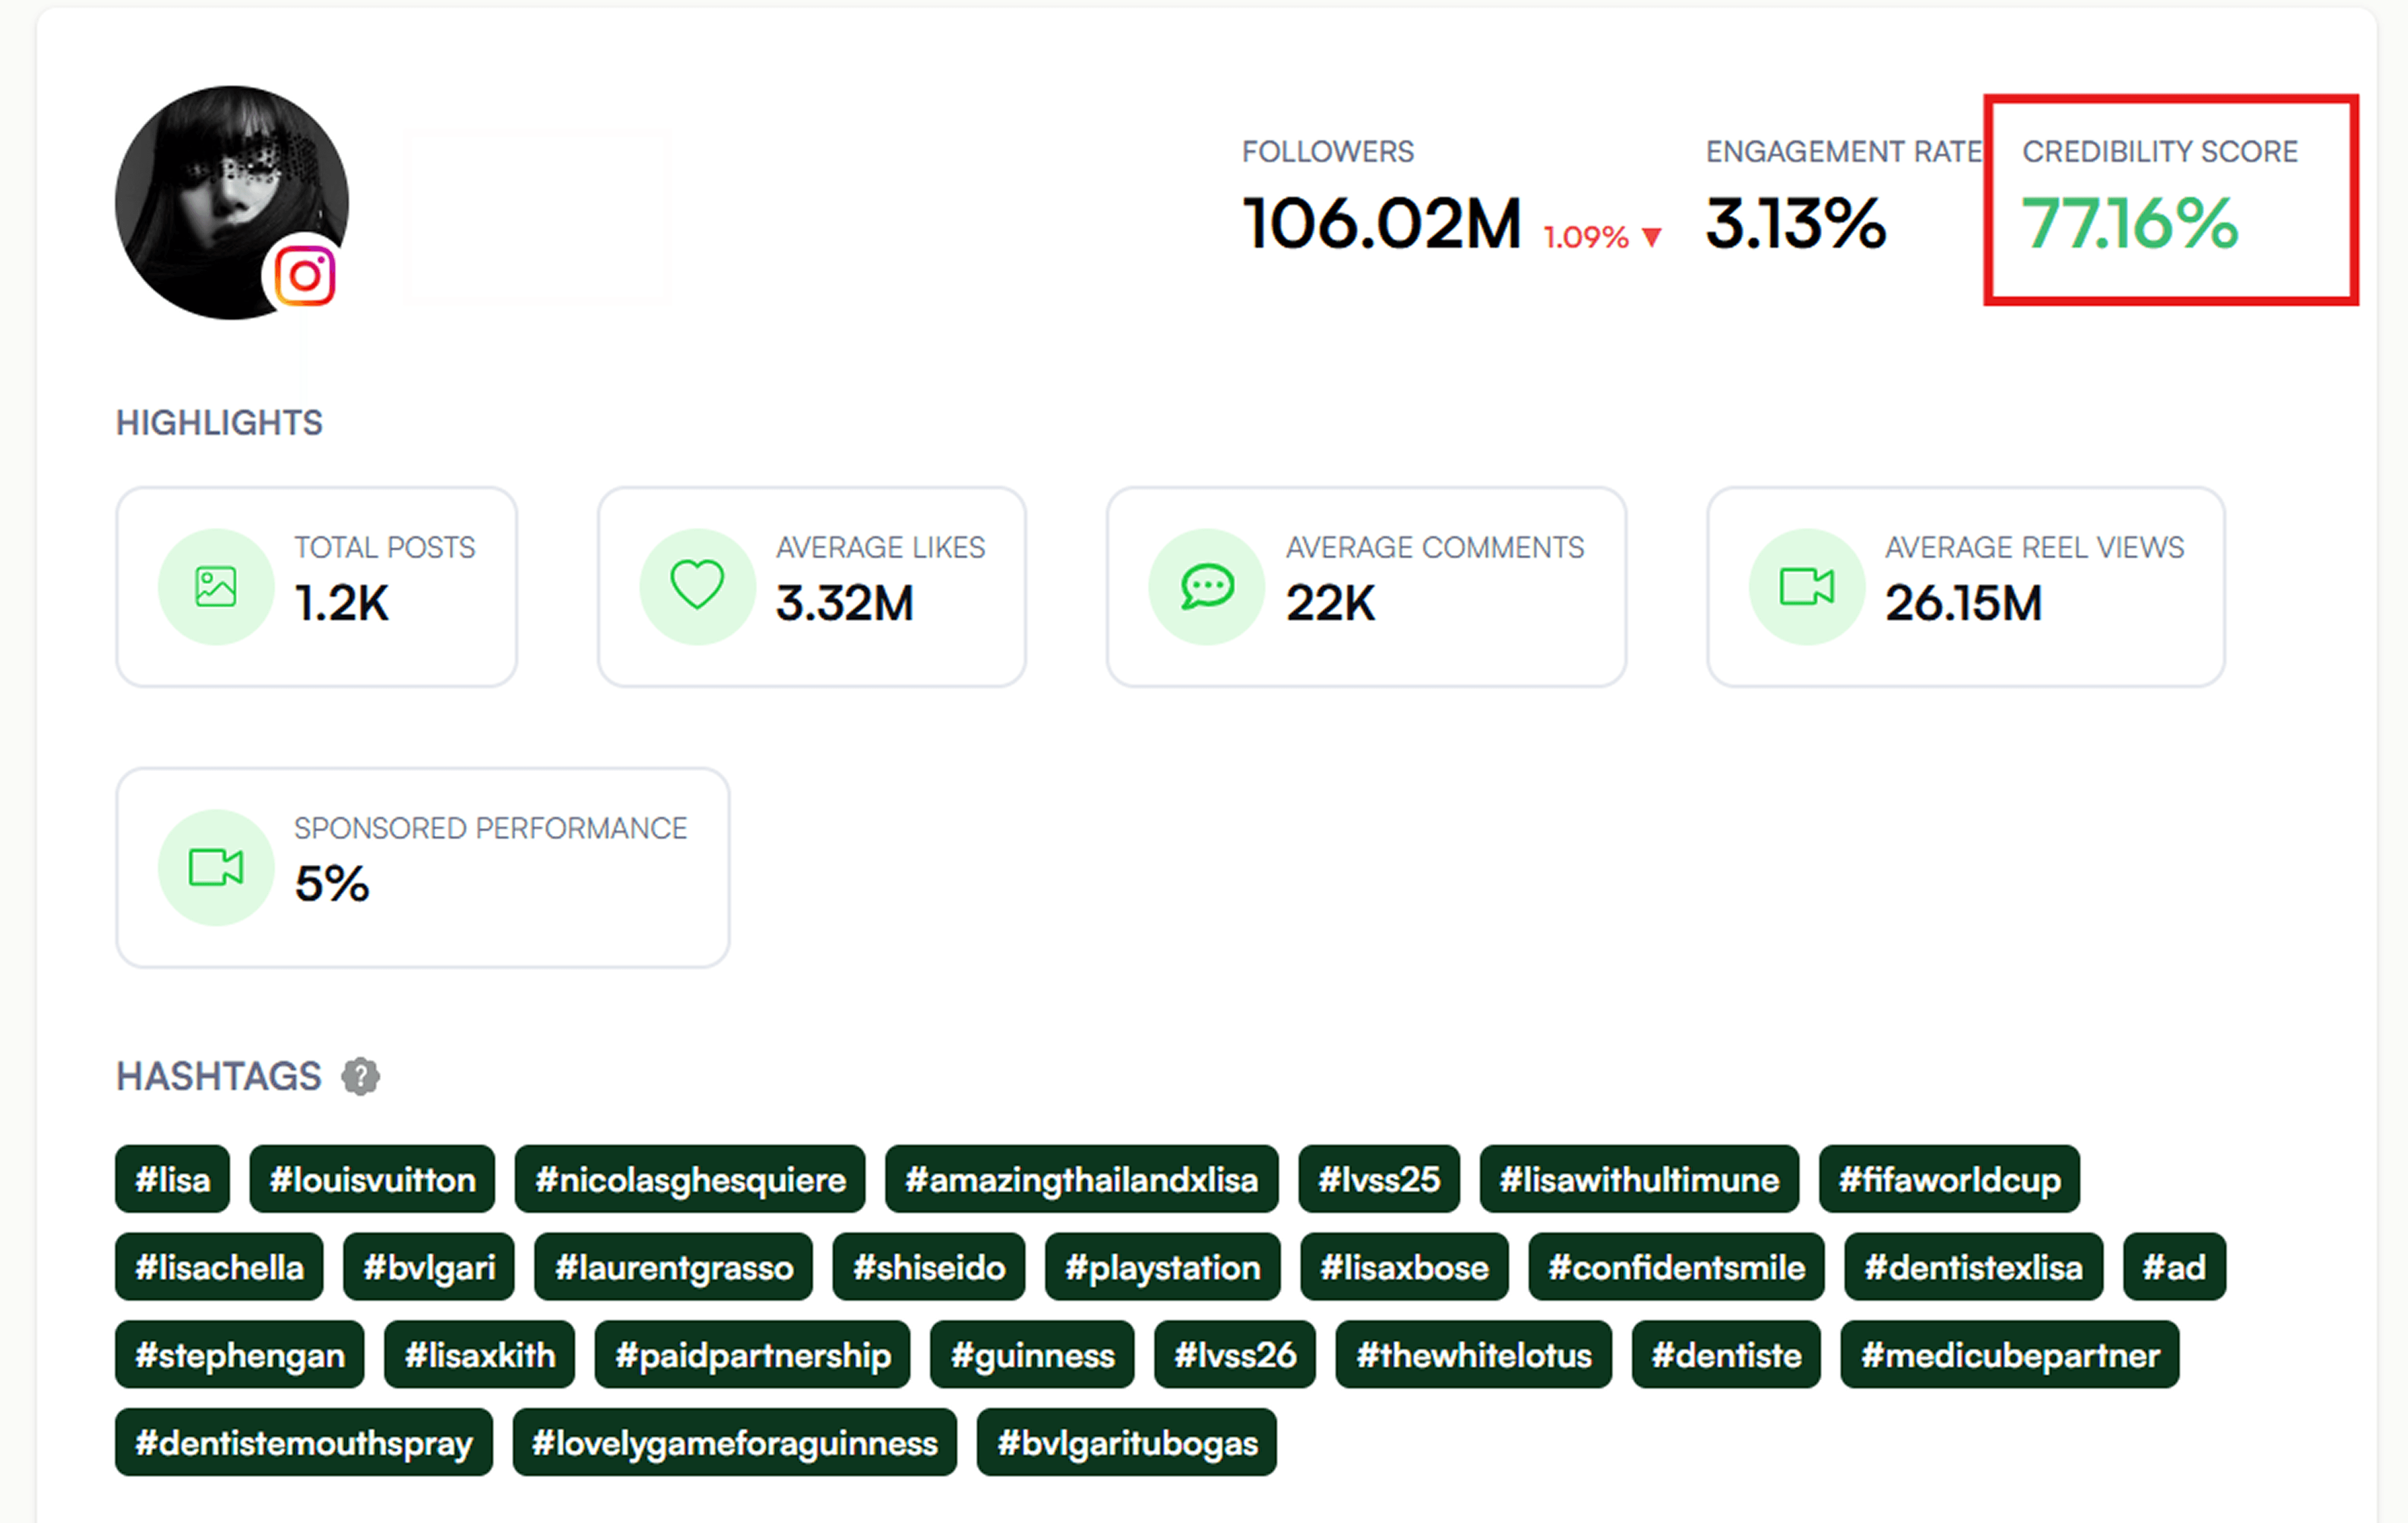
What goes into it:
Real follower percentage — what share of the creator's audience is human, regular accounts
Suspicious follower flags — bot-like patterns, sudden growth spikes, inconsistent ratios
Engagement quality — whether the likes/comments come from accounts that match the creator's stated audience, or from random/foreign/bot accounts
Sponsored Performance baseline — how their sponsored content has performed vs organic
The read-out:
80%+ green → real numbers, safe to greenlight
70-80% yellow → some noise but mostly real, run with caution
Under 70% red → audience and engagement are partly fabricated, the campaign will underperform regardless of headline ER
Also Read: The Complete Influencer Vetting Checklist: Things to Check Before You Partner
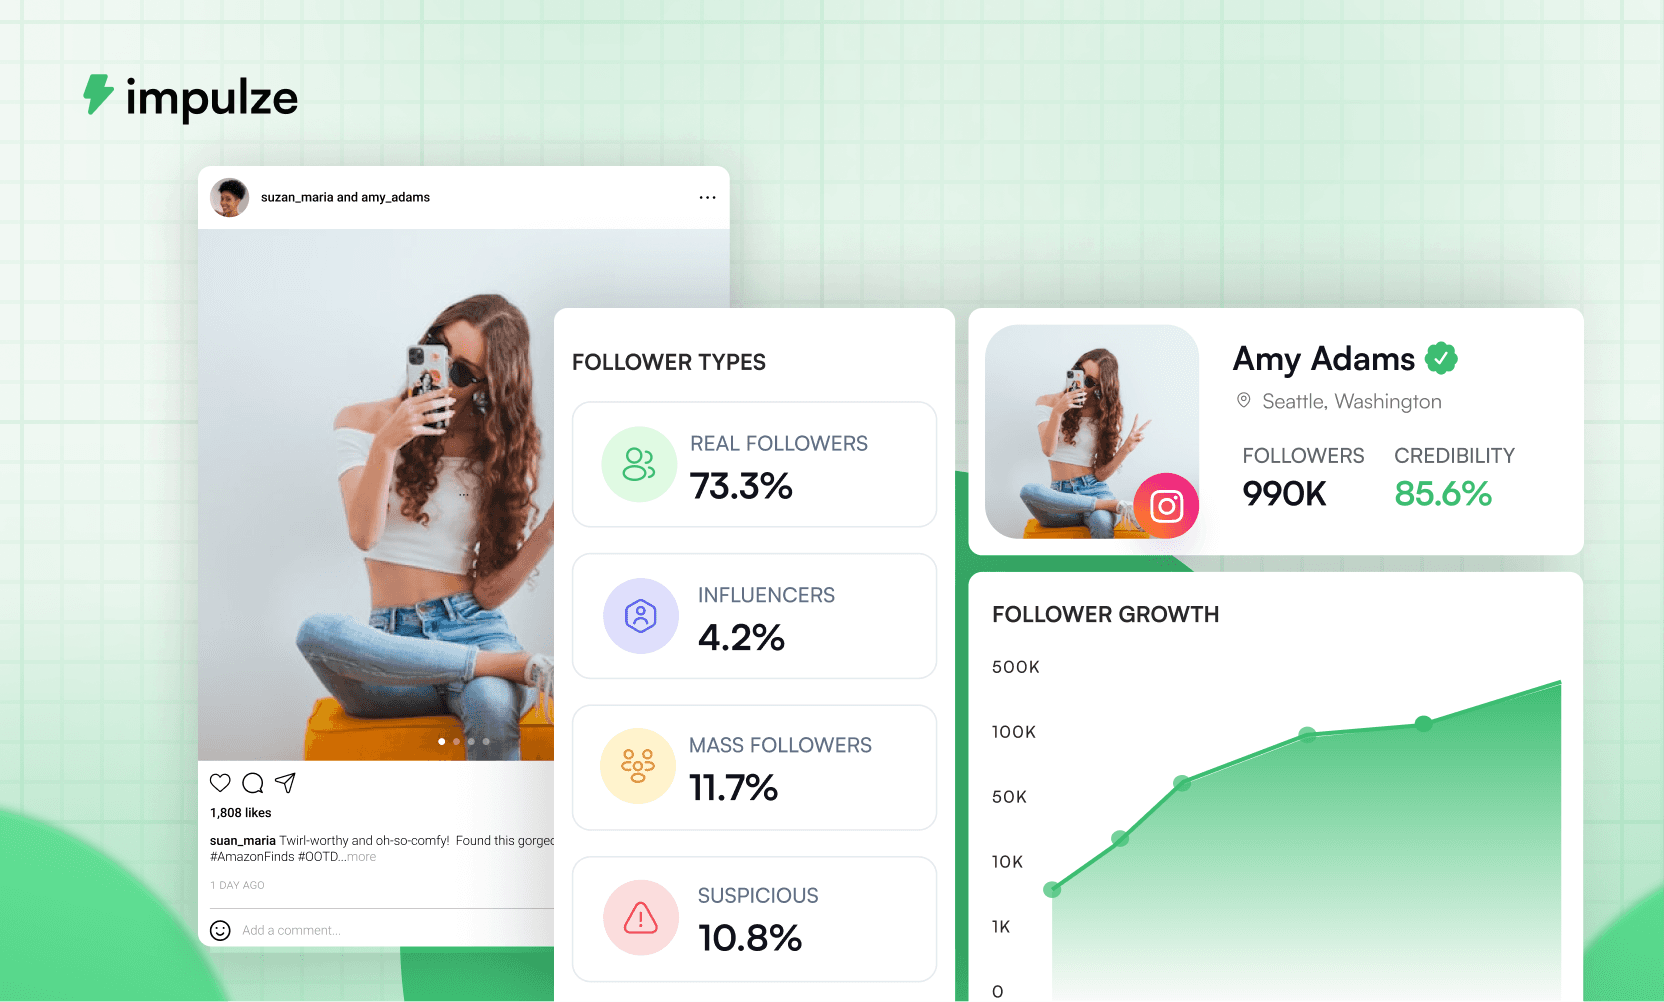
The Followers Types breakdown: where the fraud actually shows up
Inside the Influencer Report, scroll past the headline metrics and you'll see a section called Audience Details → Followers Types. It splits the creator's audience into four segments:
Real Followers — genuine humans with normal account behavior. This is the only segment that converts.
Influencers — other creators following them. Useful for reach within the creator economy but doesn't usually convert for product launches.
Mass Followers — accounts that follow 1,000+ other accounts. Real humans, but their feed is so cluttered your post barely gets a glance.
Suspicious — bot-like patterns, fake accounts. Zero conversion value.
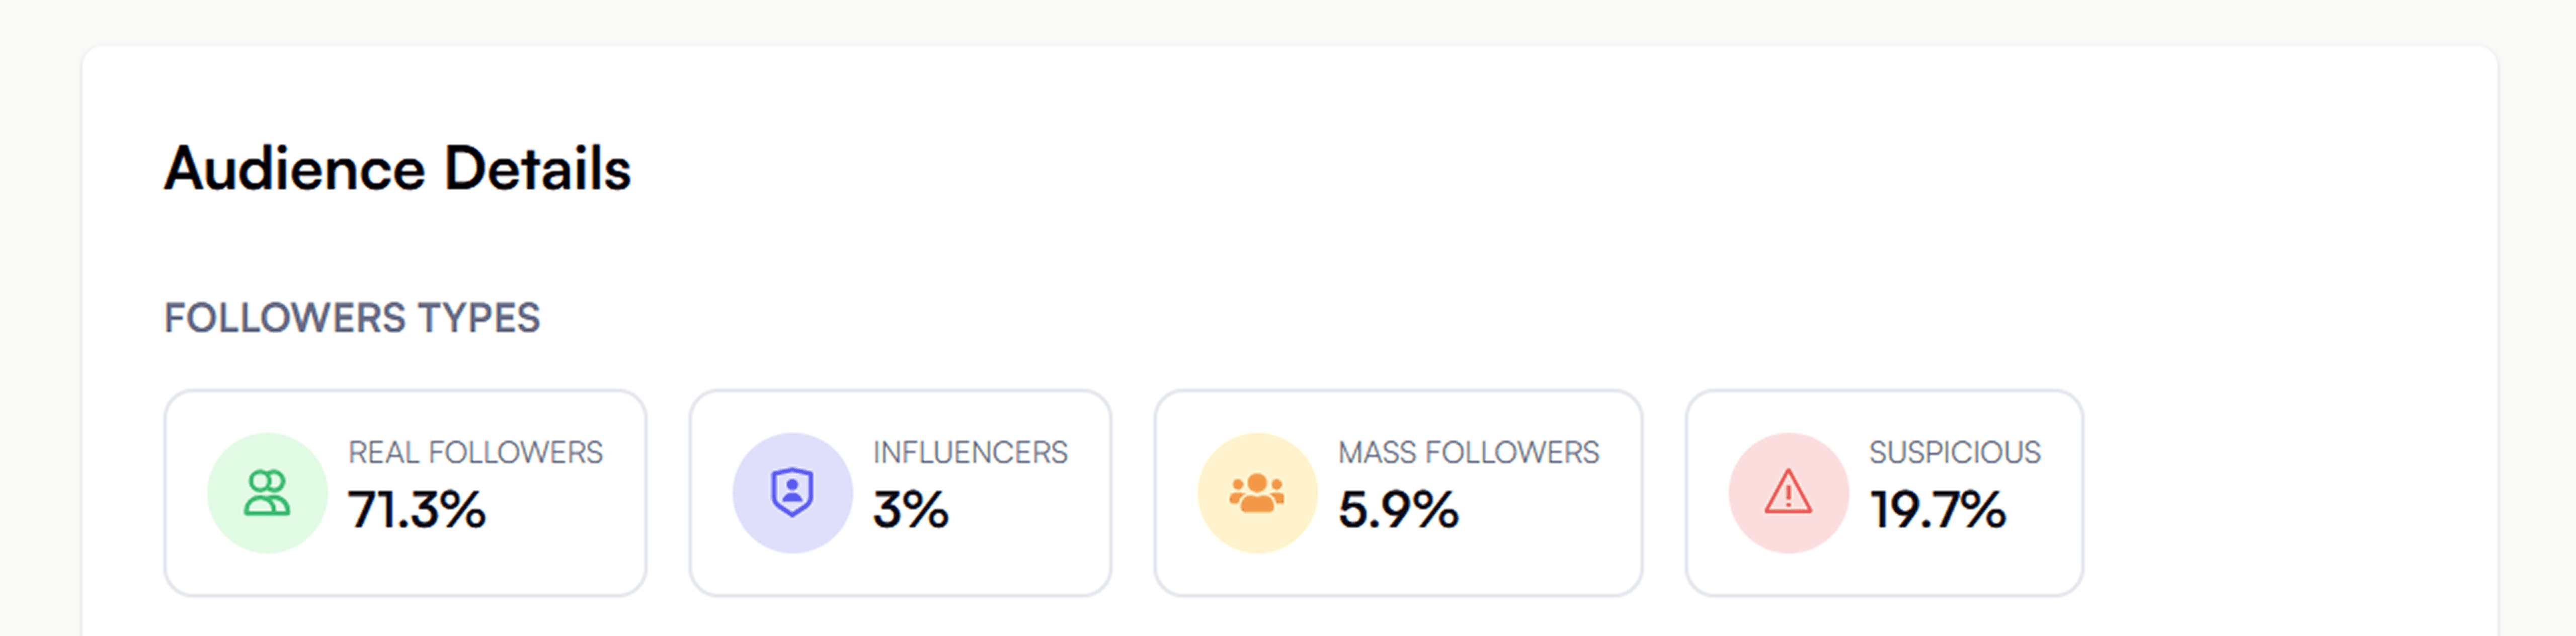
Healthy targets:
Real Followers: 65%+
Influencers: 5–15%
Mass Followers: under 20%
Suspicious: under 12%
If Suspicious is above 15%, the creator has bought followers at some point. If Mass Followers is above 30%, their audience is mostly people who'll never see your post. Either pattern tanks the campaign.
Reading the Credibility Score + Sponsored Performance together
The Credibility Score tells you whether the audience is real. The Sponsored Performance % — also in the Influencer Report's Highlights row — tells you how the creator actually performs on paid posts.
Pair them:
Credibility 80%+ green · Sponsored Performance 4%+ — Excellent. High-conversion partnership.
Credibility 80%+ green · Sponsored Performance under 1% — Real audience but sponsored content underperforms — they don't sell.
Credibility under 70% · Sponsored Performance 4%+ — Sponsored ER is real but audience is partly fake — the conversions you see are vanity.
Credibility under 70% · Sponsored Performance under 1% — Skip. Audience is fake and content doesn't sell either way.
The second pairing is the one most brands miss. A creator can have a totally real audience but be terrible at sponsored content — their viewers follow them for entertainment, not buying signals. That creator looks healthy on every fraud check and still costs you the campaign.

A 15-second walkthrough: catching an inflated creator
The marketer finds a beauty creator with 500K followers, gorgeous feed, recent Reel showing 60K likes — about 12% on that post. She's about to send a DM.
Instead, she opens Impulze, pastes the handle into Discovery, clicks Generate Report.
Eight seconds later, the report loads. The headline row says: Followers 487K · ER 12.4% · Credibility Score 58% — the Credibility Score is red.
She scrolls to Followers Types:
Real Followers: 41%
Influencers: 7%
Mass Followers: 28%
Suspicious: 24%
A quarter of this creator's audience is bot-like. The 12% engagement is partly bot-driven. The campaign she would have run for $5K would have hit maybe 200K real humans, not 487K.
She closes the tab. Moves on. The deposit she didn't wire that day was $5,000.
When average engagement alone is enough
To be fair to the average ER, it's not useless. Two situations where it's the right number first:
Brand awareness campaigns — when reach matters more than predictable conversions, you actually want the upside that a creator's viral posts represent. Average captures that potential.
Mass-market launch moments — product launches and seasonal pushes benefit from creators who occasionally land big. You're buying the lottery ticket.
For everything else — performance campaigns, recurring partnerships, DTC product placement — lead with Credibility Score, then Followers Types, then Sponsored Performance.
Pull a report on the creator you're about to pitch
You don't need to read another article. Open Impulze, paste a handle, generate the report. The verdict is in the headline row.
Inside every Influencer Report you'll get:
Credibility Score — color-coded, filter-friendly, the single fastest fraud check
Followers Types breakdown — Real / Influencers / Mass / Suspicious in one chart
Sponsored Performance % — the metric most tools don't expose
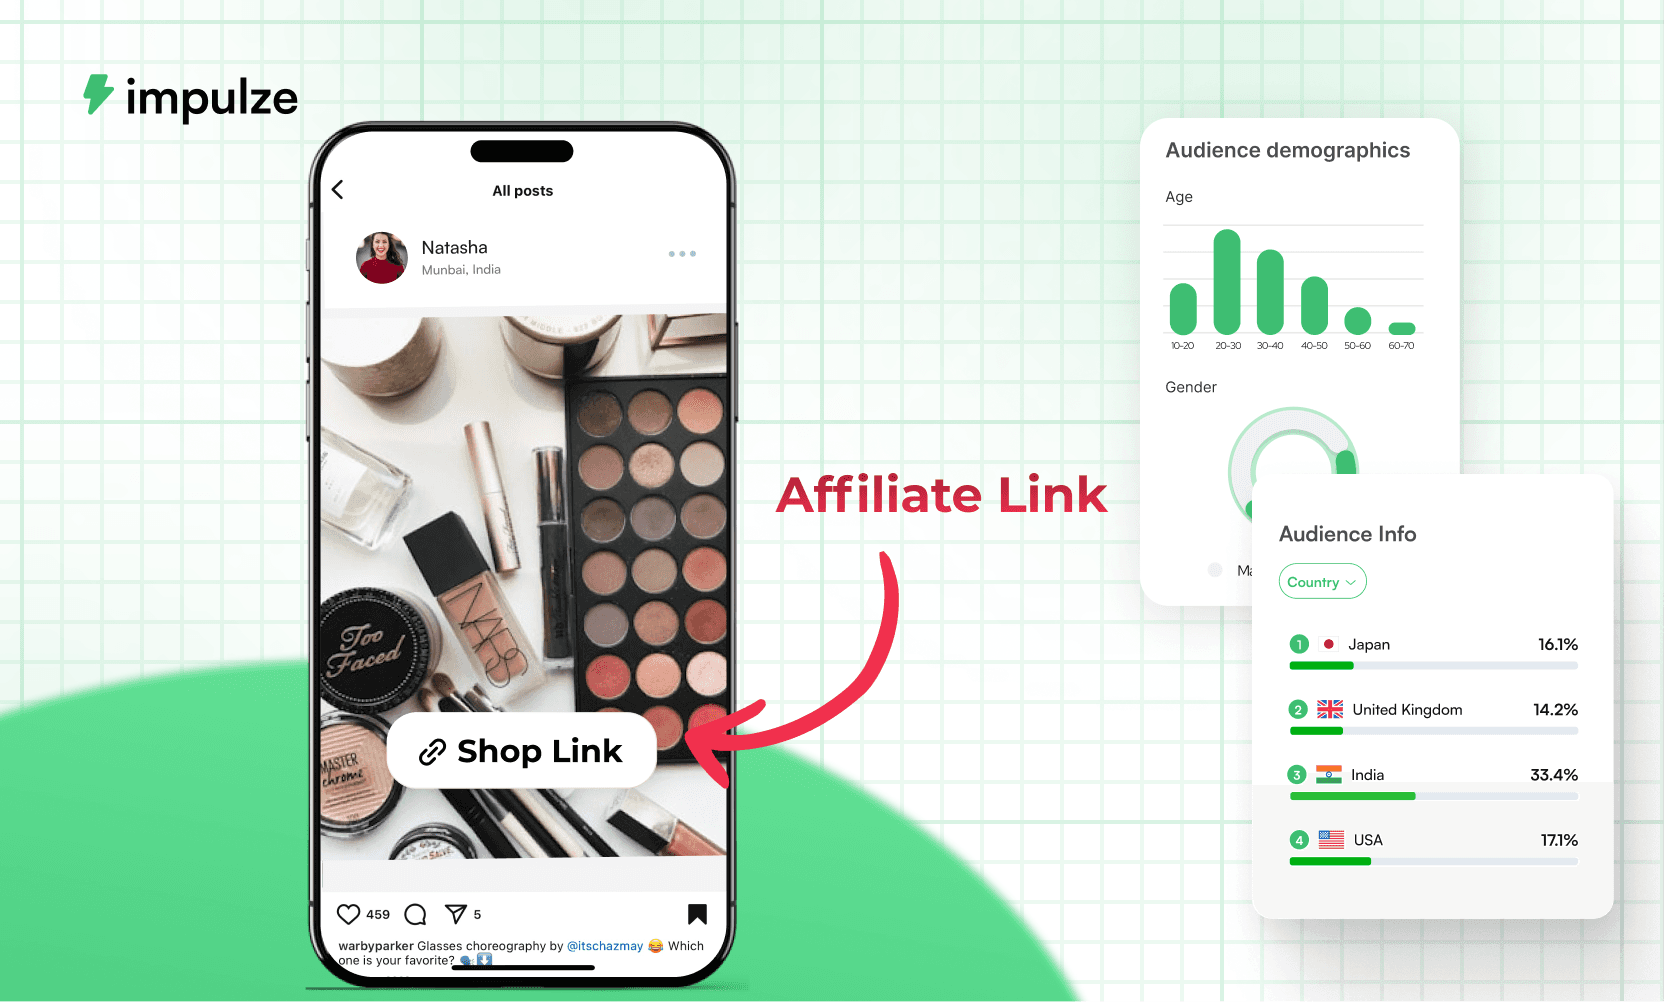
Audience demographics — age, gender, location, ethnicity, language, top interests, brand affinities
Lookalikes section — every report surfaces 10+ similar creators so deep-vetting one gives you the next ring of candidates
One report. Fifteen seconds. The $5K mistake doesn't get made.
Picture this. You're vetting a creator with 500K followers. Her last post hit 7,200 likes and 1,800 comments — about 1.8% on that post, but her profile page shows an average engagement rate of 12%.
Twelve percent on a half-million account is incredible. You greenlight the deal. You wire $5,000.
The Reel goes live. It does 4,300 likes and 38 comments. You stare at the dashboard. The math you just paid for never existed.
This happens far more often than the industry likes to admit. The cause is almost always the same: brands look at engagement rate in isolation. Let's learn what to read instead.
Why average engagement rate on its own can't be trusted
Average engagement rate is the mean — total interactions divided by total posts, divided by follower count. It's the number every influencer tool surfaces by default because it's the easiest one to calculate, and it's also the easiest to fake.
The two ways it gets inflated:
1. One viral post pulls the average up. A creator who usually gets 2,000 likes hits the algorithm once and lands 80,000 likes. Her average engagement jumps from "okay" to "amazing" for the next 90 days, even though her next 30 posts will go right back to normal.
2. Bot likes get bought. $50 buys 5,000 bot likes spread across recent posts. The average engagement spikes, the profile looks healthy, and the campaign you run goes nowhere because none of those likes belonged to humans who'd buy your product.
Average engagement alone doesn't catch either pattern. The metric that catches both is the Credibility Score.
What the Credibility Score actually measures
Inside Impulze, every Influencer Report has a Credibility Score at the top — a 0–100% percentage, color-coded green when healthy, red when not.
What goes into it:
Real follower percentage — what share of the creator's audience is human, regular accounts
Suspicious follower flags — bot-like patterns, sudden growth spikes, inconsistent ratios
Engagement quality — whether the likes/comments come from accounts that match the creator's stated audience, or from random/foreign/bot accounts
Sponsored Performance baseline — how their sponsored content has performed vs organic
The read-out:
80%+ green → real numbers, safe to greenlight
70-80% yellow → some noise but mostly real, run with caution
Under 70% red → audience and engagement are partly fabricated, the campaign will underperform regardless of headline ER
Also Read: The Complete Influencer Vetting Checklist: Things to Check Before You Partner
The Followers Types breakdown: where the fraud actually shows up
Inside the Influencer Report, scroll past the headline metrics and you'll see a section called Audience Details → Followers Types. It splits the creator's audience into four segments:
Real Followers — genuine humans with normal account behavior. This is the only segment that converts.
Influencers — other creators following them. Useful for reach within the creator economy but doesn't usually convert for product launches.
Mass Followers — accounts that follow 1,000+ other accounts. Real humans, but their feed is so cluttered your post barely gets a glance.
Suspicious — bot-like patterns, fake accounts. Zero conversion value.
Healthy targets:
Real Followers: 65%+
Influencers: 5–15%
Mass Followers: under 20%
Suspicious: under 12%
If Suspicious is above 15%, the creator has bought followers at some point. If Mass Followers is above 30%, their audience is mostly people who'll never see your post. Either pattern tanks the campaign.
Reading the Credibility Score + Sponsored Performance together
The Credibility Score tells you whether the audience is real. The Sponsored Performance % — also in the Influencer Report's Highlights row — tells you how the creator actually performs on paid posts.
Pair them:
Credibility 80%+ green · Sponsored Performance 4%+ — Excellent. High-conversion partnership.
Credibility 80%+ green · Sponsored Performance under 1% — Real audience but sponsored content underperforms — they don't sell.
Credibility under 70% · Sponsored Performance 4%+ — Sponsored ER is real but audience is partly fake — the conversions you see are vanity.
Credibility under 70% · Sponsored Performance under 1% — Skip. Audience is fake and content doesn't sell either way.
The second pairing is the one most brands miss. A creator can have a totally real audience but be terrible at sponsored content — their viewers follow them for entertainment, not buying signals. That creator looks healthy on every fraud check and still costs you the campaign.
A 15-second walkthrough: catching an inflated creator
The marketer finds a beauty creator with 500K followers, gorgeous feed, recent Reel showing 60K likes — about 12% on that post. She's about to send a DM.
Instead, she opens Impulze, pastes the handle into Discovery, clicks Generate Report.
Eight seconds later, the report loads. The headline row says: Followers 487K · ER 12.4% · Credibility Score 58% — the Credibility Score is red.
She scrolls to Followers Types:
Real Followers: 41%
Influencers: 7%
Mass Followers: 28%
Suspicious: 24%
A quarter of this creator's audience is bot-like. The 12% engagement is partly bot-driven. The campaign she would have run for $5K would have hit maybe 200K real humans, not 487K.
She closes the tab. Moves on. The deposit she didn't wire that day was $5,000.
When average engagement alone is enough
To be fair to the average ER, it's not useless. Two situations where it's the right number first:
Brand awareness campaigns — when reach matters more than predictable conversions, you actually want the upside that a creator's viral posts represent. Average captures that potential.
Mass-market launch moments — product launches and seasonal pushes benefit from creators who occasionally land big. You're buying the lottery ticket.
For everything else — performance campaigns, recurring partnerships, DTC product placement — lead with Credibility Score, then Followers Types, then Sponsored Performance.
Pull a report on the creator you're about to pitch
You don't need to read another article. Open Impulze, paste a handle, generate the report. The verdict is in the headline row.
Inside every Influencer Report you'll get:
Credibility Score — color-coded, filter-friendly, the single fastest fraud check
Followers Types breakdown — Real / Influencers / Mass / Suspicious in one chart
Sponsored Performance % — the metric most tools don't expose
Audience demographics — age, gender, location, ethnicity, language, top interests, brand affinities
Lookalikes section — every report surfaces 10+ similar creators so deep-vetting one gives you the next ring of candidates
One report. Fifteen seconds. The $5K mistake doesn't get made.
Frequently Asked Questions
What's a "good" Credibility Score?
What's a "good" Credibility Score?
Can a creator have a high Credibility Score and still be a bad partner?
Can a creator have a high Credibility Score and still be a bad partner?
How does the Credibility Score get calculated?
How does the Credibility Score get calculated?
Does Credibility Score matter as much on TikTok and YouTube Shorts?
Does Credibility Score matter as much on TikTok and YouTube Shorts?
Should I ask creators directly for their audience breakdown?
Should I ask creators directly for their audience breakdown?
We Also Recommend To Read